The Score Comparison widget displays the comparison of average scores for all shops that the manager accessing the View has permission to see.

Graph Types
Multiple graph types are supported. To change the graph type, select the corresponding option in the widget settings.
The IconoGraph
In the "Graph Types" setting, you will find a link to the IconoGraph example library. You can simply click on the IconoGraph type to get the URL to that icon. After you paste the URL to the input field, the widget will refresh and display the chosen image using colour saturation to visually represent the score.

"IconoGraph with Heat Mapping" is the same as IconoGraph except the original colours in the image are replaced with the heat map colour associated with the score.

If you don't fancy any of the icon templates in the IconoGraph library, you are free to enter a URL link to your own icon, set the Heat map option to the colour code that works for you, as well as ensure that the icon fills horizontally based on the score.
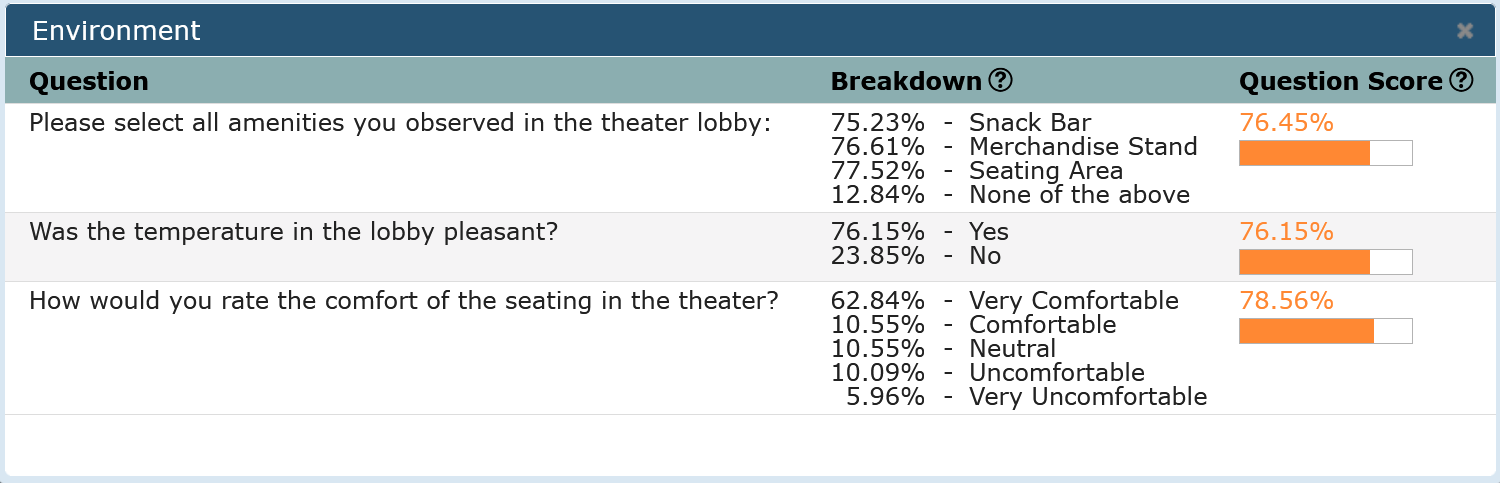
"Scores to show" setting allows you to select between the overall score, section scores or even individual questions you want to show the scores for in this widget. Combined with the "Max # items per row" option (which sets the number of graphs per row of the widget) ensures that you can set the overall look and feel of the widget to the view that is best suitable to your Client's needs.
When using sectional scores, selecting a score displays the Survey Summary widget filtered by the corresponding section.
Other settings
Remember to check a different help article detailing other settings of this widget.